Freight forwarding market outlook: how to read today’s data, news and rate cycles

  • admin 17 Min
  • Published on June 16, 2023 Updated on May 12, 2026
img

In short ⚡

Freight forwarding market outlook shows a structurally growing but more volatile industry, driven by e‑commerce, nearshoring, and shifting trade lanes between Asia, Europe, and North America. Since 2020, extreme rate spikes, capacity cuts, and recurring congestion have made reliability, digitalization, compliance, and resilience more decisive than simply chasing the lowest freight rate.

In this article, you will find an analysis of recent ocean and air rate cycles, key demand shifts from e‑commerce and nearshoring, practical indicators to read freight market news, and strategic levers for SMEs and Amazon sellers around digitalization, sustainability, and resilient freight strategies.

We hope you’ll find this article genuinely useful, but remember, if you ever feel lost at any step, whether it’s finding a supplier, validating quality, managing international shipping or customs,  DocShipper can handle it all for you!

Free shipping quote 24h      I want to talk to a sourcing expert

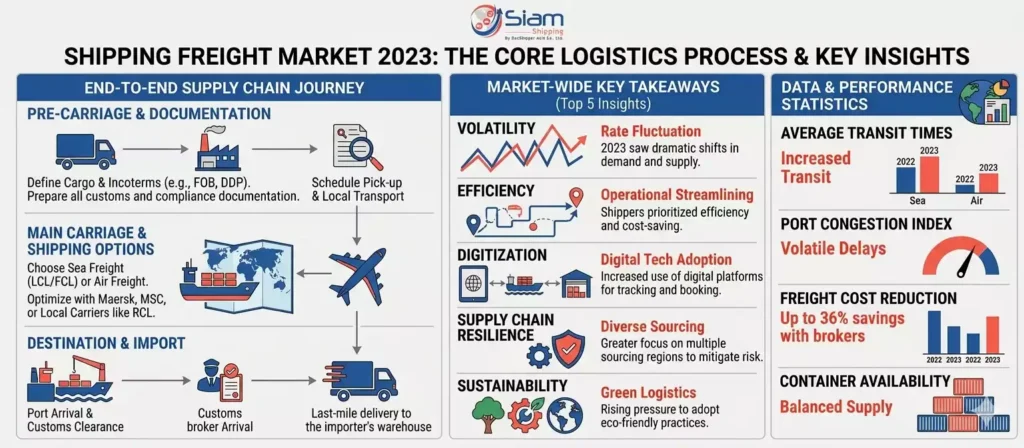
What is happening in the global freight forwarding market right now?

freight forwarder

If you’ve been following the freight forwarding market since 2020, you’ve watched it swing from “no space at any price” to “space is back, but the rules changed.”

Rates calmed down through 2022–2023 versus the peak years, yet your day-to-day reality still feels jumpy because capacity planning, carrier selection, and port reliability don’t normalize at the same speed.

From our side at DocShipper, you’ll notice fast that the winners aren’t the ones chasing the lowest spot rate, they’re the ones who lock clean processes around booking, cargo handling, customs clearance, and shipment tracking.

Checklist, what you should review this week (before you quote or book):

  • Your latest freight rate vs spot rate spread on your core lanes.
  • Carrier schedule reliability and rolled booking frequency.
  • Current lead time, including warehouse dwell time and customs brokerage turnaround.
  • Document readiness: bill of lading data, packing list, commercial invoice, HS code, and incoterms alignment.
  • Any trade compliance constraints: tariff classification, duties and taxes exposure, export licensing needs.

Workflow, a simple way we align operations with the market:

Step 1: confirm incoterms and who controls the booking, then validate cargo readiness date.

Step 2: run lane options across multimodal transport (ocean, air, rail, trucking) and shortlist carriers based on reliability, not only price.

Step 3: validate customs data (HS code, value, origin) before tendering to avoid rework and holds.

Step 4: book, then monitor cut-offs, documentation, and exceptions daily until delivery and freight audit.

Market size, key regions and growth drivers you should know

The freight forwarding market stays structurally growth-oriented because global import export still runs on consolidation, deconsolidation, and efficient distribution center networks.

Asia remains the engine room for containerization and air cargo manufacturing flows, while North America and Europe keep pulling demand through consumer goods, industrials, and pharma.

Here’s the thing, growth isn’t only “more volume.”

It’s also more complexity per shipment, more SKUs, tighter delivery windows, and stricter trade compliance.

Industry bodies like the International Air Transport Association (IATA) have repeatedly highlighted how air cargo demand and capacity cycles can move fast when passenger belly capacity shifts, and you feel that instantly in transit time promises.

In practice, we often see forwarder performance split into two camps:

  • Operational forwarders who control procurement, tendering, and carrier selection, then execute clean customs clearance and exception management.
  • Quote forwarders who win on price but struggle with schedule changes, rolled containers, and missing paperwork.

Quick real-world scenario: you negotiate FOB with a supplier, thinking you control the shipment, then their local agent issues a bill of lading with inconsistent consignee data.

That one mismatch can trigger customs queries, delay deconsolidation at destination, and blow up your warehousing and inventory management plan for the week.

Mini table, what “growth” looks like operationally:

Growth driverWhat you feel in operationsWhat to control
E-commerce expansionSmaller lots, higher frequency, tighter last mile delivery SLAsLoad optimization, palletization rules, faster customs brokerage
More compliance and enforcementMore holds, more document checks, more auditsHS code accuracy, tariff classification, commercial invoice integrity
Carrier network reshufflesBlank sailings, schedule volatility, rebookingsCapacity planning, backup routing, shipment tracking discipline

How e‑commerce, nearshoring and new trade flows reshape freight demand

In the freight forwarding market, demand doesn’t just “go up or down,” it migrates across lanes, modes, and service levels.

You’ve probably already felt it when a once-stable ocean lane becomes unpredictable, and suddenly air freight looks attractive even if the unit cost hurts.

E-commerce pushes you toward faster replenishment cycles, more cross docking, and tighter control of reverse logistics.

Nearshoring and “China+1” sourcing strategies pull volume into new origin points, which changes consolidation patterns and how you should design your warehousing footprint.

One small anecdote we see a lot: a seller moves production from South China to Vietnam to reduce risk, but keeps the same packing list format and SKU labeling.

Customs then flags inconsistencies in origin documentation, and duties and taxes calculations shift, so the shipment gets stuck right when you’re trying to protect lead time.

To stay ahead, you should map your flows like this:

  • Trade lane view: origin region, destination region, transshipment dependency.
  • Mode view: ocean vs air vs rail, including multimodal handoffs and cargo handling constraints.
  • Service view: port-to-port vs door-to-door, including customs clearance, bonded warehouse use, and last mile delivery.

And yes, you can still negotiate better, even in volatile cycles.

When we support your procurement, we focus on total landed cost and reliability, not just the freight brokerage line item.

How to interpret freight market news, indices and updates

Most freight market news is noisy because it mixes spot quotes, contract behavior, and capacity signals without telling you what’s actually actionable.

You don’t need more headlines, you need a method to translate a freight market update into booking decisions, inventory buffers, and risk flags.

Checklist, your “signal vs noise” filter for freight forwarding news:

  • Does the update specify the lane and equipment type (40’HC, reefer, air ULD), or is it generic?
  • Is it talking spot rate, contract rate, or all-in landed cost including origin and destination charges?
  • Does it mention capacity (blank sailings, aircraft utilization) and congestion, not only price?
  • Does it include a time window, and is it aligned with your tendering cycle?
  • Can you map it to your incoterms responsibilities and customs clearance lead times?

Workflow, how we convert freight market updates into an execution plan:

Step 1: tag the update by mode, lane, and time horizon (2 weeks, 1 month, 1 quarter).

Step 2: compare with your shipment calendar and supplier readiness dates.

Step 3: decide tactics, lock capacity, switch mode, split shipments, or adjust safety stock.

Step 4: update SOPs, booking cut-offs, documentation deadlines, and exception playbooks.

Looking for a Reliable Shipping & Sourcing Partner?

We handle the entire sourcing process, supplier research, negotiation, production, and inspections, so you can focus on what matters most: growing your business.

The main freight market indicators (rates, volumes, capacity, congestion)

A useful freight market read is built on four pillars: rates, volumes, capacity, and congestion.

If you only watch rates, you’ll keep getting surprised by rolled containers, missed ETDs, and warehouse bottlenecks.

  • Rates: spot rate vs contract, plus accessorials and local charges that quietly inflate your freight rate.
  • Volumes: bookings, loaded TEUs, air chargeable weight trends, which often lead price changes.
  • Capacity: blank sailings, vessel deployment, belly capacity, charter activity, which drives space risk.
  • Congestion: port dwell time, yard density, inland trucking constraints, which extend door-to-door lead time.

From experience, congestion is where plans go to die.

We’ve seen importers win a great rate, then lose two weeks because their container hits a congested node, misses a rail connection, and sits while demurrage and detention start ticking.

Quick comparison table, what each indicator tells you:

Indicator What it predicts Operational move you can take
Spot rate swings Short-term pricing pressure Split bookings, pre-book, or switch to a stable service
Capacity cuts Space risk and roll risk Earlier cargo ready dates, premium options, alternative ports
Congestion metrics Lead time extensions Adjust inventory buffers, reroute, use bonded warehouse where relevant

Where to find reliable freight market news and how to use it in your planning

Reliable freight market update sources share the same trait: they separate lane-level reality from global commentary.

You’ll do better when you combine public indices with what your forwarder sees at booking desks and terminals.

Here are sources we routinely triangulate, especially when you ask us for a go or no-go recommendation:

  • Market indices and pricing dashboards for directional rate signals.
  • Carrier advisories and schedule updates for capacity planning.
  • Port and airport operational data for congestion and dwell time.
  • Customs and trade bulletins for compliance risk, HS code enforcement, and export licensing changes.

For ocean specifically, an ocean freight market update becomes actionable when it tells you whether the shift is about blank sailings, equipment imbalances, or inland constraints.

And for daily freight forwarding news, we recommend you anchor your interpretation with one authoritative baseline like FIATA so you don’t overreact to every headline.

Micro-story that might sound familiar: you read freight market news saying “rates are down,” so you delay booking to wait for a better number.

Then your supplier misses the vessel cut-off, your consolidation window closes, and you end up paying a premium service anyway just to protect your distribution center replenishment.

When you work with us, you don’t just get headlines.

You get a lane-by-lane plan that ties procurement, documentation, customs brokerage, and shipment tracking into one execution rhythm.

Freight Forwarding Market Updates in currentyear

Siam Shipping Info

Market volatility rewards structure, not luck.
Talk to our logistics experts to secure capacity, clean documentation, and reliable customs clearance on your core lanes. Turn rate swings into controlled execution.

Siam Shipping Advice

Stop reacting to headlines, build a lane-based action plan.
Ask us for a tailored market brief aligned with your suppliers, incoterms, and booking calendar.

Ocean and air freight market update: rates, capacity and trade lane shifts

You cannot plan your logistics without understanding how the Freight forwarding market has evolved from 2020 to 2023. The rate cycles you saw during the pandemic are not anomalies, they reset expectations for volatility.

Between 2020 and late 2022, container rates on major East West trades increased by more than 300% to 500% at peak levels. In 2023, most lanes corrected sharply, but structural costs remain higher than pre COVID benchmarks.

Indicator20202021–2022 Peak2023 Trend
Asia–US West Coast (40HQ)Low and stableExtreme surge, space crisisSharp correction, volatile
Asia–Europe (40HQ)ModerateRecord highs, congestionDeclining, overcapacity signs
Air freight ratesStableCapacity crunch, high yieldsSoftening with passenger return
Port congestionLocalizedSevere global congestionImproved but recurring hotspots

You now operate in a market where capacity management is tactical, not static. Carriers blank sailings to control supply, and alliances reshape weekly departures.

  • Ocean carriers manage capacity through blank sailings and slow steaming.
  • Air cargo capacity rebounds as passenger flights return.
  • New trade lanes grow, especially Southeast Asia and India.
  • Nearshoring increases Mexico and Eastern Europe volumes.

If you import from China, you have seen production diversify to Vietnam, Thailand and India. We help you redesign your routing strategy when your sourcing footprint shifts.

You must also track equipment availability and inland bottlenecks, not just ocean rates. A low freight rate means little if your container misses the vessel cut off.

Siam Shipping Alert

A low rate without secured space is a risk.
Secure capacity and backup routing early to avoid rolled cargo, inland bottlenecks, and costly rebookings.

DocShipper Platform

One platform. Your entire supply chain

Sourcing, freight, customs & documents, all centralised, all visible, 24/7.

How SMEs and Amazon sellers can navigate freight cost volatility

navigate costs

You cannot control the market, but you can control your structure. The right freight strategy protects your margin even when the rate cycle turns.


  • Diversify Incoterms, mix FOB and EXW depending on supplier maturity.
  • Split shipments between ocean FCL, LCL and air for risk balancing.
  • Negotiate validity periods aligned with your sales cycle.
  • Build safety stock based on realistic transit time scenarios.

For Amazon sellers, timing is everything. A two week delay during peak season can destroy your ranking and cash flow.

StrategyBenefitRisk if ignored
Forecast driven bookingSecures space earlyRolled cargo, stockouts
Hybrid sea air solutionsReduces transit timeLost sales during peak
Freight cost simulationBetter pricing decisionsMargin erosion
Supplier coordinationFewer production delaysMissed vessel cut offs

You should run quarterly cost scenarios, not annual ones. We regularly simulate landed cost models for our clients to anticipate swings of 20% or more in freight components.

When you work with us, you gain visibility from factory gate to final warehouse. That visibility is your strongest hedge against volatility.

Siam Shipping Advice

Protect your margins before the cycle turns.
Request a landed cost simulation and build hybrid sea air strategies aligned with your sales forecasts.

Strategic trends for freight forwarders: digitalization, sustainability and resilience

The freight forwarding market is no longer only about price. You now compete on data, compliance and resilience.

  • Digital booking platforms and real time tracking.
  • Carbon reporting and sustainable fuel options.
  • Multi sourcing and multi routing strategies.
  • Integrated customs and trade compliance tools.

Digitalization accelerates decision making across your supply chain. You move from reactive firefighting to predictive logistics management.

TrendOperational ImpactWhat You Should Do
AutomationFaster documentation flowIntegrate systems with your forwarder
Data analyticsBetter forecasting accuracyTrack KPIs monthly
Green logisticsHigher compliance pressureMeasure CO2 per shipment
Resilience planningLower disruption impactCreate alternative routing plans

You should view sustainability as a commercial factor, not just regulatory. Large retailers increasingly require emissions transparency in tenders.

At DocShipper, we combine sourcing in China, quality control and freight coordination into one workflow. This integration reduces friction and strengthens your supply chain resilience.

Siam Shipping Info

Resilience is built on integration, not tools alone.
Centralize sourcing, compliance, and freight coordination to reduce friction and strengthen long term performance.

Conclusion

You now understand that the freight forwarding market is cyclical, data driven and increasingly strategic. Your advantage comes from preparation, not prediction.

  • Track ocean and air rate cycles, not just spot prices.
  • Adjust your sourcing geography to evolving trade lanes.
  • Build flexible shipping strategies for SMEs and Amazon models.
  • Invest in digital tools and sustainability reporting.
  • Work with a forwarder who understands end to end operations.

If you want to turn market volatility into competitive leverage, you need structure and expertise. We support you from supplier selection in Asia to final delivery, with full control over your global freight strategy.

FAQ | Freight forwarding market outlook: how to read today’s data, news and rate cycles

For most SMEs and Amazon sellers, a weekly deep dive is overkill. What works in practice is a layered rhythm: review lane-level rate movements and carrier advisories once per month, then do a quick check 10–15 days before any major shipment or sales peak. The key is to align your reviews with your tendering and replenishment cycles, not with every headline, so you only renegotiate or re-route when a change will really impact landed cost or lead time.

Ask us anything!

Need Help with
Logistics or Sourcing ?

First, we secure the right products from the right suppliers at the right price by managing the sourcing process from start to finish. Then, we simplify your shipping experience - from pickup to final delivery - ensuring any product, anywhere, is delivered at highly competitive prices.

Component-15.png

Live Chat

Get instant assistance from our team - just click and start chatting!

Chat now
image

Fill the Form

Prefer email? Send us your inquiry, and we’ll get back to you as soon as possible.

Contact Us
image

Call us

Reach out to us on WhatsApp for a quck and personal support.

Call us
image